
I’m not sure how much of my life I have spent watching progress bars, spinning circles, and animated hours glasses but it’s probably a lot. Why not make one on Twitter that can help us hold onto some strands of sanity while we wait for a COVID-19 vaccine to be rolled out?
The tl;dr
I made this Twitter bot after the idea was suggested by Mark Loaf. It calculates the percentage of the UK adult population (as estimated by ONS 2019) that have had the 1st and 2nd dose of a COVID-19 vaccination, as per data provided by the UK Gov Coronavirus dashboard. The bot was written in Python and the code is on Github.
![]() The bot running on 25/01/2021
The bot running on 25/01/2021
Why track the percentage of adults that have received vaccine doses?
People like simplicity
Mark’s original tweet with the idea was inspired by the Year Progress account on Twitter.
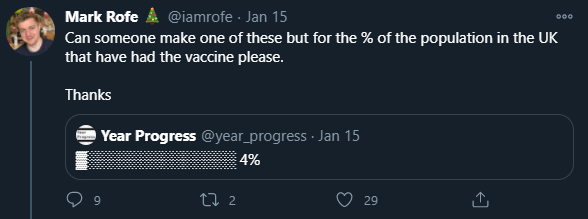 Mark’s original vaccine tweet
All this Twitter account does is provide a percentage of how far we are through the current year each week with an ASCII representation of a progress bar made from 15 characters. Simplicity is apparently appealing as the account has over half a million followers. As long as I could make something more accurate than the Window’s copy dialog, I’m sure that will be fine.
Government duplicity
As far as I understand it, for a person to be classed as “vaccinated”, they need to receive the full course (both doses) of one of the existing vaccines. This seems like a fair definition to me. These people then have the level of protection that was published from the clinical trials that were carried out. At the end of December, due to a shortage of vaccines, the UK government made the decision to extend the time between receiving both doses from 21 days to ~84 days.
At the time of writing, the current data shows approximately 1 in 10 people have received the first dose of a vaccine and unfortunately fewer than 1 in 100 has received a second dose, yet the government does tweets like these.
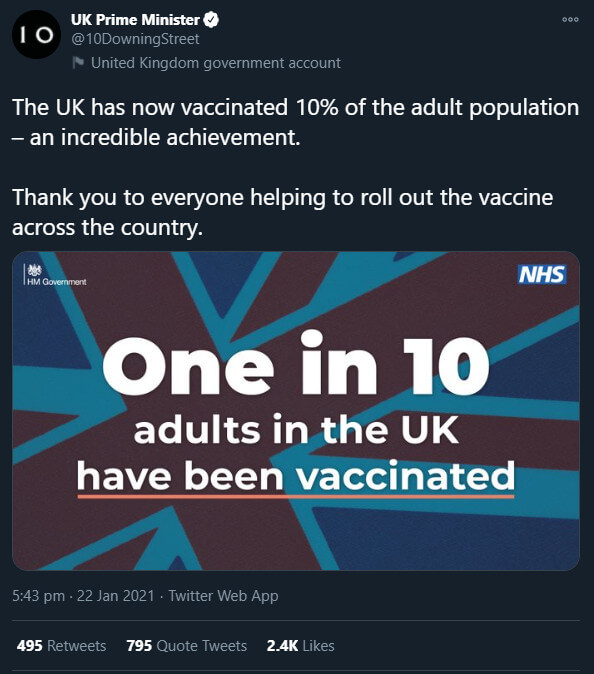 The Government’s “1 in 10” vaccinated tweet
There are lots of numbers flying around currently for vaccines per 100 people, total vaccines, combined 1st and 2nd vaccines – so I thought it would just be a lot more simple to show the progress to a 1st dose and a 2nd, “fully vaccinated” dose.
Others can use the code to make their own version
I had two people, one from the US and one from Germany contact me about making a version for their own countries. The code is very straightforward and easy to run, so I published it for anyone to use on Github. I thought it would be nice for others through social media to see how their own country’s rollouts were going.
How does the vaccine progress tracker bot work?
Python
The script is written in Python 3 so it can be run on anything from a Windows machine to a Pi.
Twitter API
As one of the primary functions of the bit is to publish on Twitter, this is accomplished easiest with access to the Twitter API. To use the script on the Github, you will need to provide your own API keys. Twitter is a lot stricter than it used to be when it comes to giving out API access now, so you need to fill in a short form that describes what your project is and what you will use access for. This project only requires access to ‘tweet’ functions and I actually linked the application to the code I was going to be using. It only took about 24 hours to get approval for the project.
I am using the Tweepy library to simplify accessing the Twitter API.
Data sources
The UK government has a Coronavirus Dashboard, which they have an ‘experimental’ area where you can download data. It’s very experimental as it was challenging to get to work. When I first selected the metrics I was interested in, such as cumPeopleVaccinatedFirstDoseByPublishDate, I was getting a “no file” error. I eventually worked out this was because that metric did not have data for the whole requested data range and if this was a case, a fatal error would occur. To get around this, you need to include any common metric they have been tracking for longer, such as cumulative admissions.
Accuracy
Originally, I based the percentage on the population of UK, until after some thought I realised it would be more accurate to just compare it to adults as there are no current plans to vaccinate under 18s. I was helped out by the community following the bot to get some more accurate numbers of people over 18 in the UK from the ONS. While this figure is from 2019, I figure the slightly lower number will account for those who have other reasons they cannot be vaccinated and of course, the anti-vaxxers…
Lastly, I request 48-hour old data from the Gov UK Coronavirus Dashboard. This was originally set to 24 hours, but I found sometimes the dashboard data was not available, which would cause an error. For this reason the tweets are also time-stamped with the date range of data they use.
How do you daily run the bot?
There’s a whole bunch of ways to do this and it depends on your platform. It could be run from a web instance or you could schedule it locally to run on your machine, you’ll just have to Google that one I’m afraid.
“Stay safe”.